The Most Diverse Public Universities in the U.S.

Photo Credit: Alamy Stock Photo
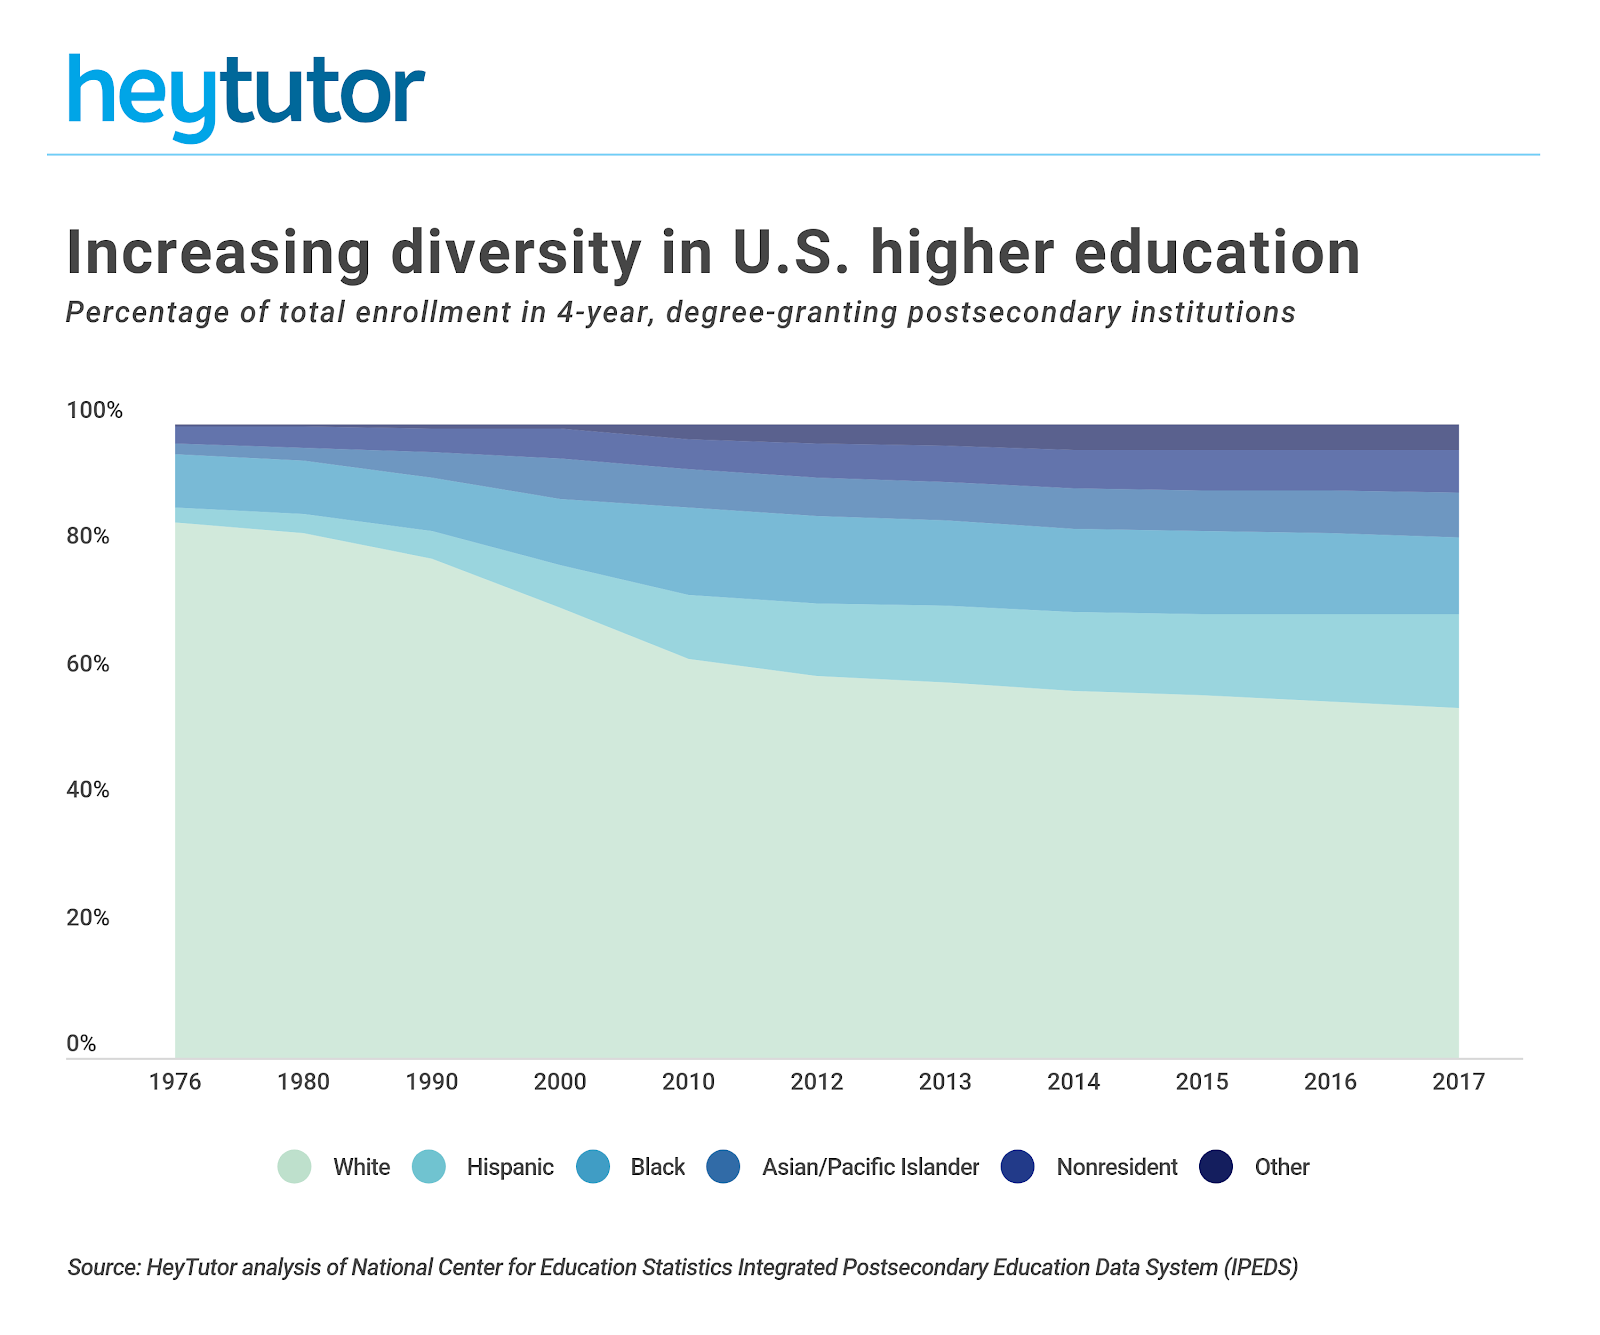
America has become an increasingly diverse nation. From 2015 to 2016, the U.S. Census Bureau reported growth among all race and ethnic groups. Asian and mixed-race populations grew by 3 percent, making them the fastest-growing demographics. Comparatively, the Hispanic population grew by 2 percent, the black or African American population grew by 1.2 percent, and the white population grew by 0.5 percent.
Despite a narrow margin of growth, whites continue to represent the majority of Americans. However, that picture is likely to change. By 2045, the U.S. Census Bureau predicts that America will become “minority white,” with whites comprising less than 50 percent of the total population. Among young people (under age 18), the shift will take place as soon as 2020.
TRENDING ON HEYTUTOR
Did you score well on the SAT? Consider becoming an SAT tutor or browse through our other open tutoring jobs near you.
Just as America has gotten more diverse, so has its system of higher education. Since the late 1970s, the percentage of minority students at four-year, degree-granting colleges and universities has consistently increased.
Interestingly, there is little difference in diversity between public and private institutions as measured by the Simpson Diversity Index, a common measure of heterogeneity among populations. Originally introduced in 1949 for applications in ecology, The Simpson Diversity Index represents the likelihood that two individuals selected at random from a population will be of the same type. Across both public and private four-year institutions in the U.S., there is about a 65 percent chance than any two students chosen randomly will be of the same racial/ethnic group.

Rather than whether a university is public or private, its location is a much stronger predictor of diversity. America’s most diverse colleges, as measured by the Simpson Diversity Index, are predominantly found in California, New York, and Texas. In general, Western states have a more diverse student body, while Midwestern states tend to be less diverse.

With these geographic differences in mind, researchers at HeyTutor wanted to determine which universities in the U.S. are the most and least diverse. Young people represent the most diverse group in the nation, and it is important to understand how this demographic is changing the makeup of the higher education system.
To find America’s most diverse public colleges, researchers at HeyTutor analyzed data from the National Center for Education Statistics (NCES) Integrated Postsecondary Education Data System (IPEDS). HeyTutor looked at fall 2017 undergraduate enrollment at more than 550 four-year, public, degree-granting institutions. They examined race/ethnicity data and calculated a diversity index for each school. For the diversity index, students that are not U.S. citizens or nationals (nonresidents) are considered a separate group. Additionally, HeyTutor grouped schools into the following cohorts based on size:
Large schools: more than 20,000 students
Midsize schools: 5,000 to 20,000 students
Small schools: fewer than 5,000 students
Across all public four-year universities, the diversity index ranges from a high of 79.24 to a low of 7.02. Schools that skew toward the upper end of the diversity index have a more equal distribution of students across different racial/ethnic groups. On the other hand, schools with a low diversity index tend to have a single group that accounts for most of the student body. This is most common among schools in the South that are predominantly African American or Hispanic.
The diversity index of total undergraduate enrollment across all four-year public universities is 63.36, based on the following racial/ethnic breakdown: white (54.4 percent), Hispanic (16.2 percent), black (10.5 percent), Asian (7.3 percent), nonresident (4.5 percent), and other races (6.5 percent).
Here are the most diverse public universities in the U.S.

The most diverse large public universities
Photo Credit: Laxmatt / Wikimedia Commons
15. George Mason University
Diversity index: 73.79
Total undergraduate enrollment: 25,010
White: 10,323 (41.3%)
Hispanic: 3,551 (14.2%)
Black or African American: 2,760 (11.0%)
Asian: 5,011 (20.0%)
Nonresident: 1,459 (5.8%)
Other races: 1,234 (4.9%)
George Mason University in Fairfax, Virginia lists diversity as one of its core values. In fact, national data shows George Mason is Virginia’s most diverse university. The university has the second highest share of African American students among the schools on this list. The university’s percentage of African American students is higher than the national average of 10.47 percent. George Mason’s Office of Diversity, Inclusion, and Multicultural Education regularly hosts diversity-focused events such as the Donning of the Kente ceremony, which celebrates new graduates of black or African heritage.

Photo Credit: Alamy Stock Photo
14. Rutgers University-New Brunswick
Diversity index: 73.82
Total undergraduate enrollment: 35,641
White: 13,834 (38.8%)
Hispanic: 4,669 (13.1%)
Black or African American: 2,562 (7.2%)
Asian: 9,449 (26.5%)
Nonresident: 3,212 (9.0%)
Other races: 1,269 (3.6%)
Located in New Jersey, Rutgers University New Brunswick also touts itself as a diverse campus, describing diversity as “an everyday ingredient of university life.” According to the Advocate College Guide for LGBT Students, Rutgers New Brunswick is also a top 100 campus for the LGBT community. Compared to the other schools on this list, Rutgers has the lowest share of Hispanic students. The school offers several study programs in diversity, including global affairs, African-American history, and gender studies.
Photo Credit: Alamy Stock Photo

13. San Jose State University
Diversity index: 73.99
Total undergraduate enrollment: 27,778
White: 4,478 (16.1%)
Hispanic: 7,742 (27.9%)
Black or African American: 944 (3.4%)
Asian: 9,904 (35.7%)
Nonresident: 2,097 (7.5%)
Other races: 1,521 (5.5%)
San Jose State University in California has a very small percentage of black students, but its Hispanic and Asian populations are both larger than its white population. In fact, San Jose State has one of the lowest proportions of white students among large public universities. San Jose has implemented a Diversity Action Plan to foster an environment that welcomes a diverse population. The university also describes diversity, equity, and inclusion as “inseparable” from its mission of academic excellence.
Photo Credit: Alamy Stock Photo

12. San Diego State University
Diversity index: 74.41
Total undergraduate enrollment: 30,272
White: 10,079 (33.3%)
Hispanic: 9,307 (30.7%)
Black or African American: 1,194 (3.9%)
Asian: 4,015 (13.3%)
Nonresident: 2,178 (7.2%)
Other races: 2,182 (7.2%)
California’s San Diego State University also has a sizable Hispanic student population and a relatively small African American population. One-third of the school’s students are white, while nearly one-third are Hispanic. San Diego describes itself as “a proud Hispanic Serving Institution residing on the historical lands of the Kumeyaay.” The school’s Office of Diversity, Equity, and Inclusion is tasked with creating an inclusive experience for both students and faculty members.
Photo Credit: EMBaero / Wikimedia Commons

11. The University of Texas at Arlington
Diversity index: 74.51
Total undergraduate enrollment: 33,307
White: 12,095 (36.3%)
Hispanic: 9,138 (27.4%)
Black or African American: 4,924 (14.8%)
Asian: 3,783 (11.4%)
Nonresident: 1,365 (4.1%)
Other races: 1,339 (4.0%)
The University of Texas at Arlington has a truly diverse student population of Hispanic, Asian, and black or African American students. The school exceeds the national average in each of these demographics and has an especially high population of Hispanic students at 27.4 percent. Located in Arlington, Texas, and within the Dallas-Fort Worth metro area, the university has an overall diversity index of 74.51. All students at the University of Texas at Arlington are invited to become Multicultural Mavericks (a nod to the school’s mascot). These students help host campus celebrations in support of diversity and culture.
Photo Credit: Alamy Stock Photo

10. University of California-Irvine
Diversity index: 74.80
Total undergraduate enrollment: 29,307
White: 4,092 (14.0%)
Hispanic: 7,751 (26.4%)
Black or African American: 563 (1.9%)
Asian: 10,455 (35.7%)
Nonresident: 4,906 (16.7%)
Other races: 1,222 (4.2%)
At nearly 17 percent, The University of California-Irvine (UCI) has the fourth highest share of foreign students of any public university in the country. Asians represent the largest student group at UCI, and the school’s Hispanic students also outnumber white students. Among its many diversity-focused initiatives, UC Irvine in Irvine, California, offers a freshman seminar on bias, prejudice, and bigotry. Through weekly conversations, students gain a greater understanding of how to promote inclusiveness on campus. The university also hosts an ongoing lecture series on diversity-related topics that is open to all students, faculty, and staff, as well as the public.
TRENDING ON HEYTUTOR
HeyTutor provides access to both online and private tutoring across a range of subjects. Two of our most popular services are math tutoring and english tutoring.
Photo Credit: Alamy Stock Photo
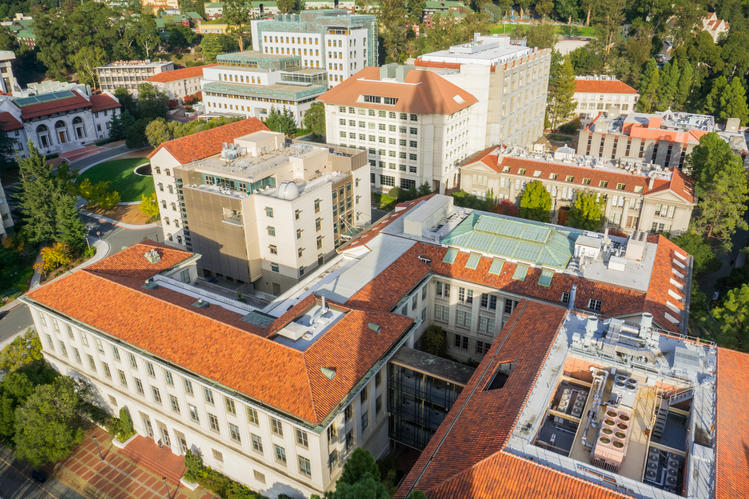
9. University of California-Berkeley
Diversity index: 75.14
Total undergraduate enrollment: 30,574
White: 7,867 (25.7%)
Hispanic: 4,731 (15.5%)
Black or African American: 535 (1.7%)
Asian: 10,555 (34.5%)
Nonresident: 3,752 (12.3%)
Other races: 1,843 (6.0%)
Despite being one of the most diverse large public universities in the country, UC Berkeley isn’t satisfied with its current representation among certain groups. The school’s diversity dashboard highlights a lack of representation among minority groups when compared to California as a whole. A main focus of the university’s Division of Equity and Inclusion is to help create a student body that fully represents California’s uniquely diverse population—an ambitious goal. Berkeley’s efforts in this area highlight the school’s commitment to advancing social justice and creating an equitable educational experience for students of all backgrounds.
Photo Credit: Alamy Stock Photo

8. University of Houston
Diversity index: 75.40
Total undergraduate enrollment: 37,215
White: 8,965 (24.1%)
Hispanic: 12,781 (34.3%)
Black or African American: 3,717 (10.0%)
Asian: 8,285 (22.3%)
Nonresident: 1,538 (4.1%)
Other races: 1,342 (3.6%)
Located in Texas, University of Houston (UH) has a larger percentage of Hispanic students than white students. In fact, the share of Hispanic students at the school is the highest of all the schools on this list. UH reports that over half of its students are from historically underrepresented groups. The school’s Center for Diversity and Inclusion serves as the campus hub for engaging, empowering, and educating students, faculty, and staff. The Center touts the Diversity Institute and Culture Connect Week as its two signature programs.
Photo Credit: Alamy Stock Photo

7. California State University-Sacramento
Diversity index: 75.59
Total undergraduate enrollment: 28,454
White: 7,407 (26.0%)
Hispanic: 8,779 (30.9%)
Black or African American: 1,687 (5.9%)
Asian: 5,888 (20.7%)
Nonresident: 833 (2.9%)
Other races: 2,056 (7.2%)
Located in the state capital, California State University-Sacramento has a highly diverse student body with notably large Asian and Hispanic populations. In fact, Hispanic students outnumber white students. At Sacramento State as it is commonly called, the Office of Inclusive Excellence oversees efforts to embed equity, diversity, and inclusion into the fabric of the university. The school is also home to the Multi-Cultural Center, a meeting and educational space that was created to support and build diverse communities.
Photo Credit: Alamy Stock Photo

6. University of California-San Diego
Diversity index: 76.10
Total undergraduate enrollment: 28,587
White: 5,540 (19.4%)
Hispanic: 5,284 (18.5%)
Black or African American: 441 (1.5%)
Asian: 9,894 (34.6%)
Nonresident: 5,546 (19.4%)
Other races: 1,436 (5.0%)
Located in La Jolla, University of California-San Diego (UCSD) prides itself on its diverse student body. Asians represent the largest share of the university’s student population, and the school has nearly as many Hispanic students as white students. UCSD also has the second highest percentage of foreign students of any public university in the country. The university reports that it has made significant progress toward its goal of inclusivity. By 2018 the number of new freshman from underrepresented groups had more than doubled since 2012.
Photo Credit: Alamy Stock Photo

5. San Francisco State University
Diversity index: 76.32
Total undergraduate enrollment: 26,680
White: 4,791 (18.0%)
Hispanic: 8,732 (32.7%)
Black or African American: 1,461 (5.5%)
Asian: 6,887 (25.8%)
Nonresident: 1,906 (7.1%)
Other races: 1,819 (6.8%)
Located in the heart of San Francisco, SF State is one of the nations most diverse public universities. Similar to other UC schools, SF State has a large proportion of both Hispanic and Asian students. In fact, both minority groups outnumber white undergraduates. The school opened its Division of Equity and Community Inclusion in 2017 with the goal of improving the campus climate for all students. The university offers several programs to support underrepresented student groups, such as the Asian American and Pacific Islander Student Services and the Black Unity Center.
TRENDING ON HEYTUTOR
Looking for help in one of your classes? We have hundreds of tutors near you that can help. We have calculus tutors, physics tutors, chemistry tutors, and more.
Photo Credit: Alamy Stock Photo

4. University of California-Santa Barbara
Diversity index: 76.51
Total undergraduate enrollment: 22,186
White: 7,086 (31.9%)
Hispanic: 5,891 (26.6%)
Black or African American: 502 (2.3%)
Asian: 4,029 (18.2%)
Nonresident: 2,189 (9.9%)
Other races: 1,899 (8.6%)
Located on the beach in Santa Barbara, UCSB has a prominent white, Hispanic, Asian, and nonresident undergraduate presence. The population of African Americans, on the other hand, is below average. UCSB adheres to the University of California’s Diversity statement and is focused on “promoting excellence through diversity and inclusiveness.” The school’s Student Resources Building is home to organizations that cater to most underrepresented groups. The African Diasporic Cultural Resource Center, the Asian Resource Center, and the Chicanx/Latinx Cultural Resource Center are all found there.
Photo Credit: Alamy Stock Photo

3. University of Nevada-Las Vegas
Diversity index: 76.87
Total undergraduate enrollment: 25,279
White: 8,016 (31.7%)
Hispanic: 7,338 (29.0%)
Black or African American: 1,979 (7.8%)
Asian: 3,920 (15.5%)
Nonresident: 897 (3.5%)
Other races: 2,877 (11.4%)
The University of Nevada-Las Vegas is home to a student population that includes 29 percent Hispanic students and 15.5 percent Asian students. These numbers place UNLV well above the national average for each demographic. The school hosts more than 50 cultural, ethnic, and religious-based organizations. UNLV also boasts “The Intersection,” a multicultural academic center for students, faculty, and staff that was created to help students, particularly first-generation and students of color, succeed in their academic careers.
Photo Credit: Alamy Stock Photo

2. University of California-Los Angeles
Diversity index: 77.31
Total undergraduate enrollment: 31,002
White: 8,278 (26.7%)
Hispanic: 6,884 (22.2%)
Black or African American: 1,059 (3.4%)
Asian: 8,709 (28.1%)
Nonresident: 3,645 (11.8%)
Other races: 1,754 (5.7%)
University of California-Los Angeles has a nonresident student population that is more than twice the national proportion of 4.5 percent. The school also has above average Hsipanic and Asian enrollment. UCLA describes itself as “one of the world’s most ethnically and culturally diverse communities.” Students come from all 50 U.S. states and more than 100 foreign countries. The mission of UCLA’s Office of Equity, Diversity, and Inclusion is to “build an equal learning, working, and living environment, by holding ourselves accountable to our professed ideals.”
Photo Credit: Alamy Stock Photo

1. University of California-Davis
Diversity index: 77.64
Total undergraduate enrollment: 30,066
White: 7,560 (25.1%)
Hispanic: 6,449 (21.4%)
Black or African American: 669 (2.2%)
Asian: 8,532 (28.4%)
Nonresident: 4,712 (15.7%)
Other races: 1,732 (5.8%)
Located just outside of Sacramento, the University of California-Davis is the most diverse large public university in the country. At UC Davis, Asian students represent the largest undergraduate cohort, and there is strong representation among most minority groups. Despite a below average African American presence, the school has one of the highest percentages of foreign students of any public university in the country. The school has a strategic vision for diversity and inclusion. Each year, it awards grants to individuals and groups on campus who come up with innovative proposals to help the university fulfill that vision.
Methodology
The data used in this analysis is from the National Center for Education Statistics (NCES) Integrated Postsecondary Education Data System (IPEDS). Only four-year, public, degree-granting institutions that are primarily baccalaureate and above were included in the analysis. Additionally, institutions that primarily offer distance-based learning were excluded.
For each institution, a Simpson Diversity Index was calculated based on fall 2017 undergraduate enrollment data from the NCES. Students with unknown race/ethnicity were not included in the analysis, which is the reason some of the diversity breakdowns do not sum to 100 percent. The diversity index can be interpreted as the probability that any two students chosen at random will belong to separate racial/ethnic groups. For the purpose of this analysis, students that are not U.S. citizens or nationals (nonresidents) are considered a separate group in calculating the index.
Schools were grouped into the following categories based on undergraduate enrollment:
- Large schools: more than 20,000 students
- Midsize schools: 5,000 - 20,000 students
- Small schools: less than 5,000 students

